SPSS is a powerful tool for statistical analysis, widely used in research and data-driven decision-making. Whether you're a beginner or looking to refine your skills, this collection of tutorials provides step-by-step guidance on essential SPSS functions. From computing and recoding variables to conducting advanced statistical tests, each topic is explained in a simple and practical way. These tutorials will help you understand key concepts, analyze data efficiently, and draw meaningful insights with confidence. Whether you're new to data analysis or preparing a research report, these step-by-step guides and video lessons will help you master SPSS with confidence.
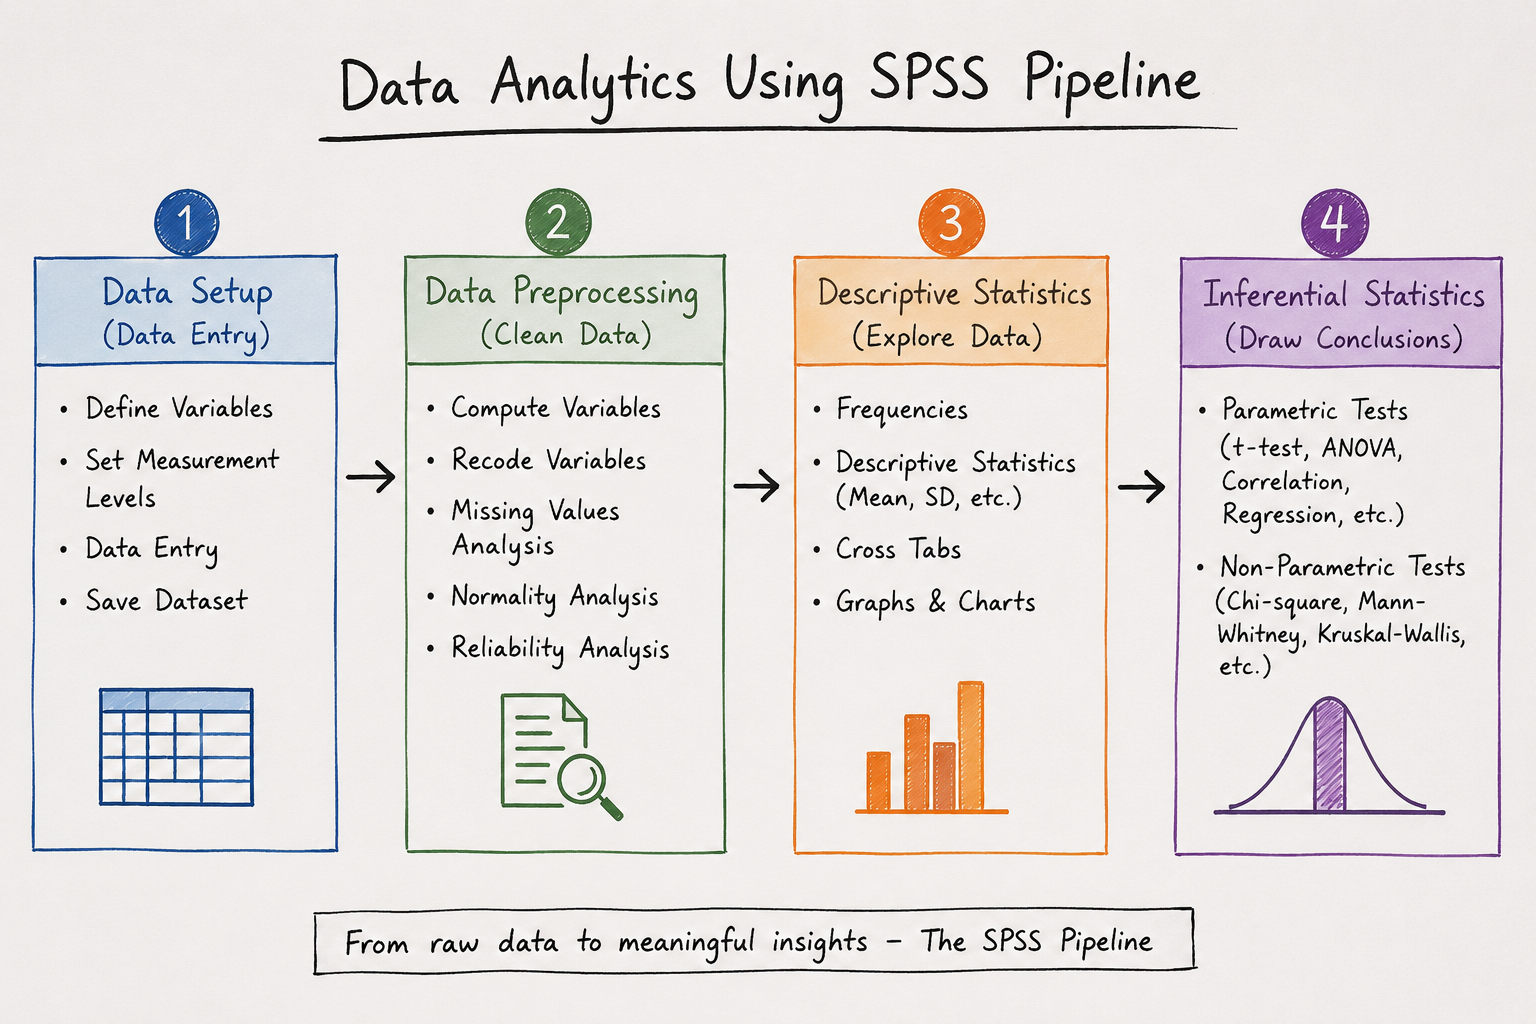
The data analytics pipeline contains four major steps to conduct any data analysis. These involve Data Setup, Data PreProcessing, Descriptive Statistics, and Inferential Statistics.
In order to start off the data analysis, the first step is to take the questionnaire, and code it into SPSS. Once the variables have been defined, we set the measurement levels, and do the data entry. This helps us to properly code the data file which is used in the analysis onwards.
Data Preprocessing phase is helppul in cleaning the data, and make it ready for the analysis. For instance, we might need to transform some variables through compute and recode variable techniques. Our dataset might contain missing values, requiring us to conduct missing values analysis. We may also consider Normality Analysis as part of the process. In case of Likert Scale, we usually conduct reliability analysis. These analysis help us refine our dataset through series of steps.
Next, we conduct descriptive statistics. These statistics provide us an abstract picture of how our dataset looks like. For instance, we prepare frequency tables, calculate averages, check variable dependencies, and develope some charts and graphs.
In Inferential Statistics, we draw conclusions. We conduct one or more statisitical tests depending upon the type of data that include parameteric and non-paremeteric tests in order to conclude on our objectives.
Overall, this pipepline takes raw data as an input and transforms it to meaningful insights through a series of steps.