This guide helps you to understand about data types used in the SPSS tool, how to setup a simple survey in SPSS, and how to perform data entry.
Understanding data types and data entry in SPSS is crucial for accurate data analysis. SPSS has 3 major data types (these are called measures) that include Nominal, Ordinal, and Scale. The Scale measure could actually be divided into interval and ratio. Understanding each measure/type is necessary, because every statistical operation depends upon the measure. For instance, Chi-Square Test for Independence of variables is only valid for finding relationship between two variables which are nominal or ordinal. In the following, I describe each of the measures with some examples.
Gender variable as Nominal, by setting 1=Male, 2=Female. However, the numbers 1,2 are merely codes, and don't reflect any meaning. This simply means that we could only perform COUNT or MODE operation on this type of variable. Some other exmaples include, Eye Color: Green, Brown, Blue; Department: Computer Science, Biological Sciences, Bio Technology, etc.Education. This variable may contain values like 1=BS, 2=MS, 3=PHD, 4=PostDoc. These numbers are given in a sequence, so this data could be sorted in ascending or descending order. Similarly, ranked values are also ordinal, i.e. a likert scale like: 1=Strongly Agree, 2=Somewhat Agree, 3=Neutral, 4=Somewhat Disagree, 5=Strongly Disagree. interval, and ratio types. The interval variable defines numeric type of data, however, there is no absolute zero concept. For instance, in temperature scales, we can't define two numbers from a single reference point (0), i.e. why two numbers of this type can not be multiplied or divided, however, distance is meaningful, i.e, the distance between points is equal or has units. The other type, i.e. ratio defines all numbers with respect to an absolute zero, so each number could be referred throught that zero, and therefore, you could create a relationship between two values. For instance, in terms of height, an adult has 6 feet height, compared to a kid of 3 feet height. In this case, the adult's height is 2 times that of the kid's height. Suppose that we have the following survey to setup in SPSS:

We have created this survey to see how much satisfied are, our participants. We collect this data from different trainings participants over time. After collecting this information, we could run several analysis. Here are a few examples:
Descriptive Statistics with a single column:
Experience of the participants who attend the trainings?Education Level is more interested in our trainings?Training received most of the participants?Trainer/Instructor conducts more trainings?Satisfaction Rate?How about if we draw descriptives on two columns now:
Education Level is more interested in SPSS Trainings?Masters attended LaTeX trainings?Education Level is least interested in Mendeley trainings?trainer/instructor received most PhD participants for training?traininer/instructor has most Satisfaction Rate?We could also drill this to third level, for instance:
Education Level who attend SPSS Trainings are most Satisfied?Masters who attended LaTeX trainings were Not Satisfied at all?Bachelor participants trained by which Instructor were Highly Satisfied?Now, lets think about inferential statistics:
Experience differs based upon Education Level?Training Type and Instructor?Instructors differ based on Satisfaction Level or the participants consider themselves equally Satisified when trained by different Instructors?Experience and Satisfaction Score?
All of these questions could be answered by analysing the data through SPSS. SPSS provides a user-friendly Data View and Variable View interface to input, edit, and structure datasets efficiently.
Let me guide you through a step by step process to create an SPSS data file.
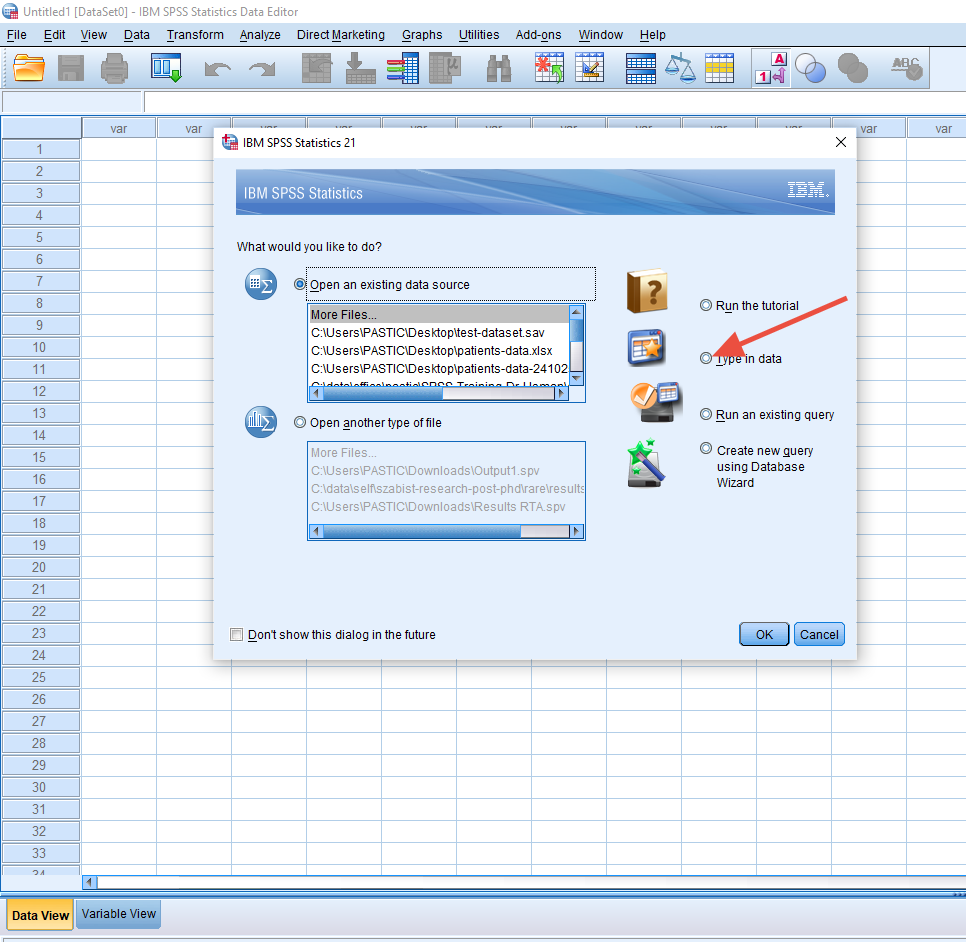
Step 1: Select IBM SPSS Statistics from your menu, that will open a screen given below. Select Type in Data option, and continue.
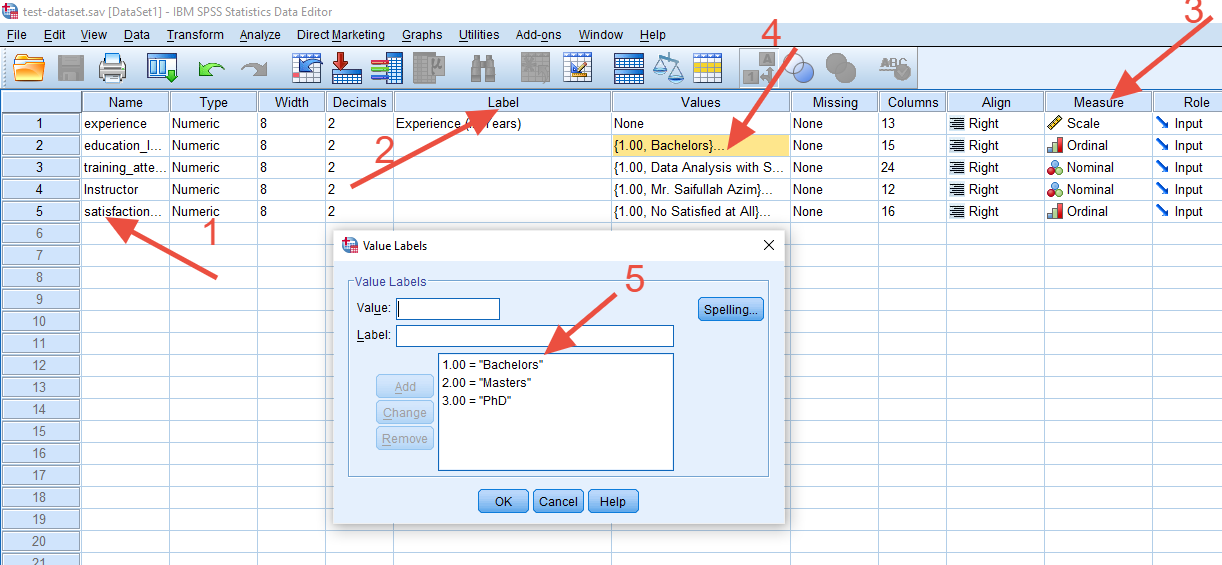
Step 2: Switch to Variable View option from bottom-left screen. This view allows you to add all variables which are required for data entry. In our case, we will create 5 variables. Lets name them as experience, education_level, training_type, instructor, and satisifcation_rate. These names are to be used in the first column (see 1 in the figure below), whereas, you could write the whole question or full text (with spaces) into the Label column (see 2 in the figure below), because the Name column wont allow you to use spaces, very similar to a username for a signup process on a website. We need to keep the Type as it is, and shift to Measure (see 3 in the figure below), and select proper measure for each of the variables. Since we need to enter integer values for the age variable, we will keep it as Scale. We need to setup the education_level variable as an ordinal, since there are ordered categories here. Additionally, we need to use Values option (see 4 in the figure below) to provide values for the levels (see 5 in the figure below). Remember, that we need to maintain the sequence here to ensure that there is a logical connection between the values, i.e. Master should appear after Bachelor, and Phd should appear after Master, using the number codes. Next, we need to setup the training_type. Since this variable also contain categories, but there is no sequence this time between categorical values, therefore, we will opt the Nominal measure in this case. We will setup values in a similar fashion to that of education_level without considering any sequence. Next, we need to enter instructor in the same way as training_type. The satisfaction_rate will be setup like education_level. This step confirms that all of the variables in the survey are not available for data entry purpose.
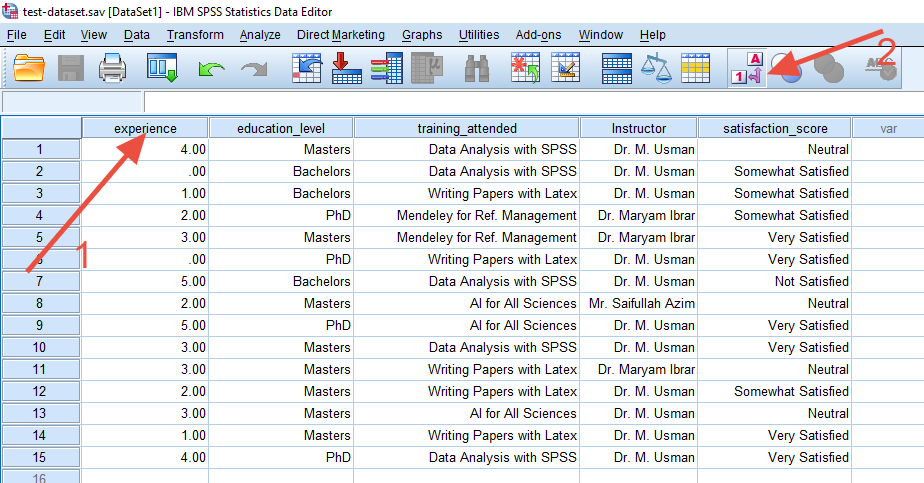
Step 3: Now, since we have the variables ready for data entry, lets switch to Data View from bottom left of the window. It gives us a screen like we have in the figure below. We have a list of variables that we had setup through the Design Variable option (see 1 in the figure below). The data could be added for each sample. One thing to consider here is that, we will use keyboard to enter values for open questions, and use mouse to select values for each of the nominal and ordinal attributes. That gives us a facility to quickly fill up the data. If you want to view the codes against nominal/ordinal columns, you could use the option 1/A in the toolbar as indicated by 2 in the figure.
Now that you have understood the process, you could also take help to understand the data types through the video recorded below.
Whether it's for your thesis, assignment, or research project, I offer one-on-one guidance and support.

Discover how to recode variables in SPSS. A step-by-step guide for modifying data values.

Discover how to recode variables in SPSS. A step-by-step guide for modifying data values.

Learn to handle missing data in SPSS. A simple tutorial for analyzing and managing missing values.